Advanced workstation performance for peak productivity
Choose your superpower
The world’s fastest workstation processor.
AMD Ryzen™ Threadripper PRO 7000 WX-Series Processors, with PRO manageability, eight-channel memory, and 128 PCle® 5.0 lanes.
Up to
96cores
CPU
Up to
192threads
CPU
Up to
5.1GHz
Max. Boost Clock
Support for up to
128PCIe 5.0
Lanes
Support for up to
2TB
DDR5 RDIMM 5200
Unrivaled full spectrum performance
Shop DevicesAccelerate 3D model and environment creation, iterate on the fly, and render in real time.
- Up to223%faster inChaos V-Ray
- Up to91%faster inAutodesk Maya
- Up to18%faster inAdobe Premier Pro
- Up to9%faster inAdobe After Effects
Blaze through data preparation and transformation tasks with the next-gen AMD Ryzen™ Threadripper™ CPU.
- Up to50%faster inUnreal Engine
- Up to28%faster inChromium
Accelerate advanced 3D modeling, generative design, and real-time rendering with a desktop workstation capable of handling the different compute requirements of professional software applications.
- Up to52%faster inAgisoft Metashape
- Up to49%faster inChaos Corona
- Up to20%faster inAutodesk Revit
- Up to37%faster inAutoCAD
Power through advanced 3D modeling, renderings, and visualizations. Blaze through multithreaded tasks like simulation and generative design—even in VR.
- Up to45%faster inDassault Solidworks
- Up to44%faster inLuxion Keyshot
- Up to39%faster inAnsys Mechanical
- Up to25%faster inPTC Creo
Ideal platform for Al development
- Unmatched expandability for AI training and GPU compute
- Platform supports multiple GPUs for pre-scale Al/ML training
- Optimize and refine Al algorithms prior to scaling in the cloud
- Enables edge-based Al training and inference
Up to
189%
more accurate
when using Llama-2
with 70 billion parameters
with 70 billion parameters
World class companies lovethe performance, you will too
Shop Devices
Binyan Studios Accelerates Integrated Content Creation with AMD. Binyan Studios expanded their global business for AEC customers using Lenovo workstations and servers powered by AMD Ryzen™ Threadripper™ PRO and AMD EPYC™ processors.

AMD Ryzen™ Threadripper™ boosts the performance of MTI Film’s CORTEX, helping it lead the way in IMF packaging and post production.
Accelerate your creative vision
Shop DevicesThe ultimate platform for lightning-fast creative workloads
Ultra‑high bandwidth meets ultra‑versatility.
WRX90
TRX50
Chipset
Processor support
AMD Ryzen™ Threadripper PRO 7000 WX-Series Processors
AMD Ryzen™ Threadripper PRO 7000 WX-series Processors
AMD Ryzen™ Threadripper 7000 series Processors
Memory configuration
8-Channel
up to 2TBoverclockable DDR5 RDIMM 5200
up to 2TBoverclockable DDR5 RDIMM 5200
4-Channel
up to 1TBoverclockable DDR5 RDIMM 5200
up to 1TBoverclockable DDR5 RDIMM 5200
IO
128 PCleⓇ 5.0
4x USB 3.1
Azalia, SW 1.2, Dolby ATMOS offload
4x USB 3.1
Azalia, SW 1.2, Dolby ATMOS offload
48 PCleⓇ 5.0 + 32 PCleⓇ 4.0
4x USB 3.1
Azalia, SW 1.2, Dolby ATMOS offload
4x USB 3.1
Azalia, SW 1.2, Dolby ATMOS offload
Overclocking enabled
AMD PRO Technologies
Design. Build. Accelerate.
On The Ultimate Workstation Processor
HP
Z6 G5 A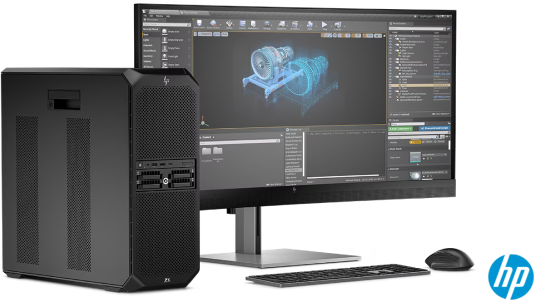
- CPU:Up to AMD Ryzen™ Threadripper™ PRO 7000 WX-Series CPU
- RAM:Up to 2TB DDR5
- OS:Up to Windows 11 Pro
Lenovo
ThinkStation P620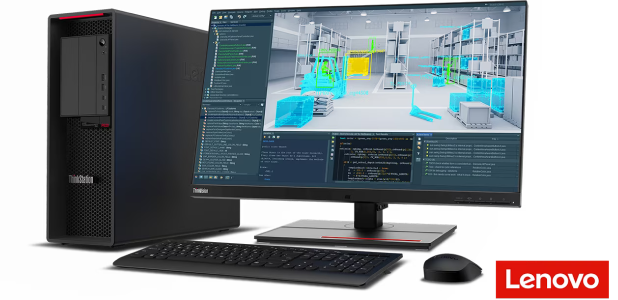
- CPU:Up to AMD Ryzen™ Threadripper™ PRO 7000 WX-Series CPU
- RAM:Up to 2TB DDR5
- OS:Up to Windows 11 Pro
Dell
Precision 7865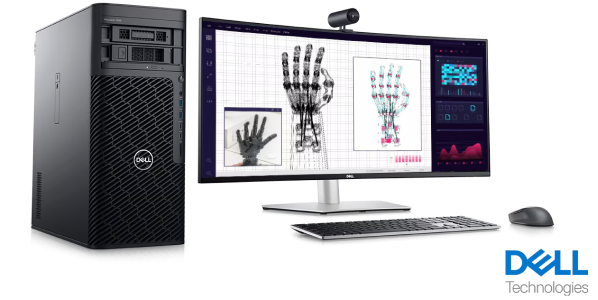
- CPU:Up to AMD Ryzen™ Threadripper™ PRO 7000 WX-Series CPU
- RAM:Up to 2 TB DDR5
- OS:Up to Windows 11 Pro
Supermicro
A+ SuperWorkstation 5014A-TT
- CPU:Up to AMD Ryzen™ Threadripper™ PRO 7000 WX-Series CPU
- RAM:Up to 2 TB DDR5
- OS:Up to Windows 11 Pro
Dell
Precision 7875
- CPU:Up to AMD Ryzen™ Threadripper™ PRO 7000 WX-Series CPU
- RAM:Up to 2 TB DDR5
- OS:Up to Windows 11 Pro
AMD Ryzen™ Threadripper™ Processors
| Model | Cores / Threads | Process | Max. Boost Clock | TDP | AMD PRO Technologies |
|---|---|---|---|---|---|
| AMD Ryzen™ Threadripper™ PRO 7995WX | 96 / 192 | 4nm | Up to 5.1GHz | 350W | |
| AMD Ryzen™ Threadripper™ PRO 7985WX | 64 / 128 | 4nm | Up to 5.1GHz | 350W | |
| AMD Ryzen™ Threadripper™ PRO 7975WX | 32 / 64 | 4nm | Up to 5.3GHz | 350W | |
| AMD Ryzen™ Threadripper™ PRO 7965WX | 24 / 48 | 4nm | Up to 5.3GHz | 350W | |
| AMD Ryzen™ Threadripper™ PRO 7955WX | 16 / 32 | 4nm | Up to 5.3GHz | 350W | |
| AMD Ryzen™ Threadripper™ PRO 7945WX | 12 / 24 | 4nm | Up to 5.3GHz | 350W |
Advancing Environmental Sustainability at AMD
At AMD, we embrace the responsibility to help protect our planet and mitigate climate change through environmental programs and initiatives that extend across our value chain.
2022-23 CR REPORT SUMMARYGet in touch
Need more information about AMD Ryzen™ Threadripper™ PRO Processors for your business? Contact a performance specialist and find out what AMD can do for your organization.
Contact sales